The signal is already there
Imagine three reports written months apart: a crowded walkway, equipment blocking access, and a near miss during a delivery. Individually, each deserves attention. Together, they might reveal a recurring problem. This illustrative example captures the challenge: organizations have the observations, but connecting them takes work.
A count tells you how much—not what to investigate
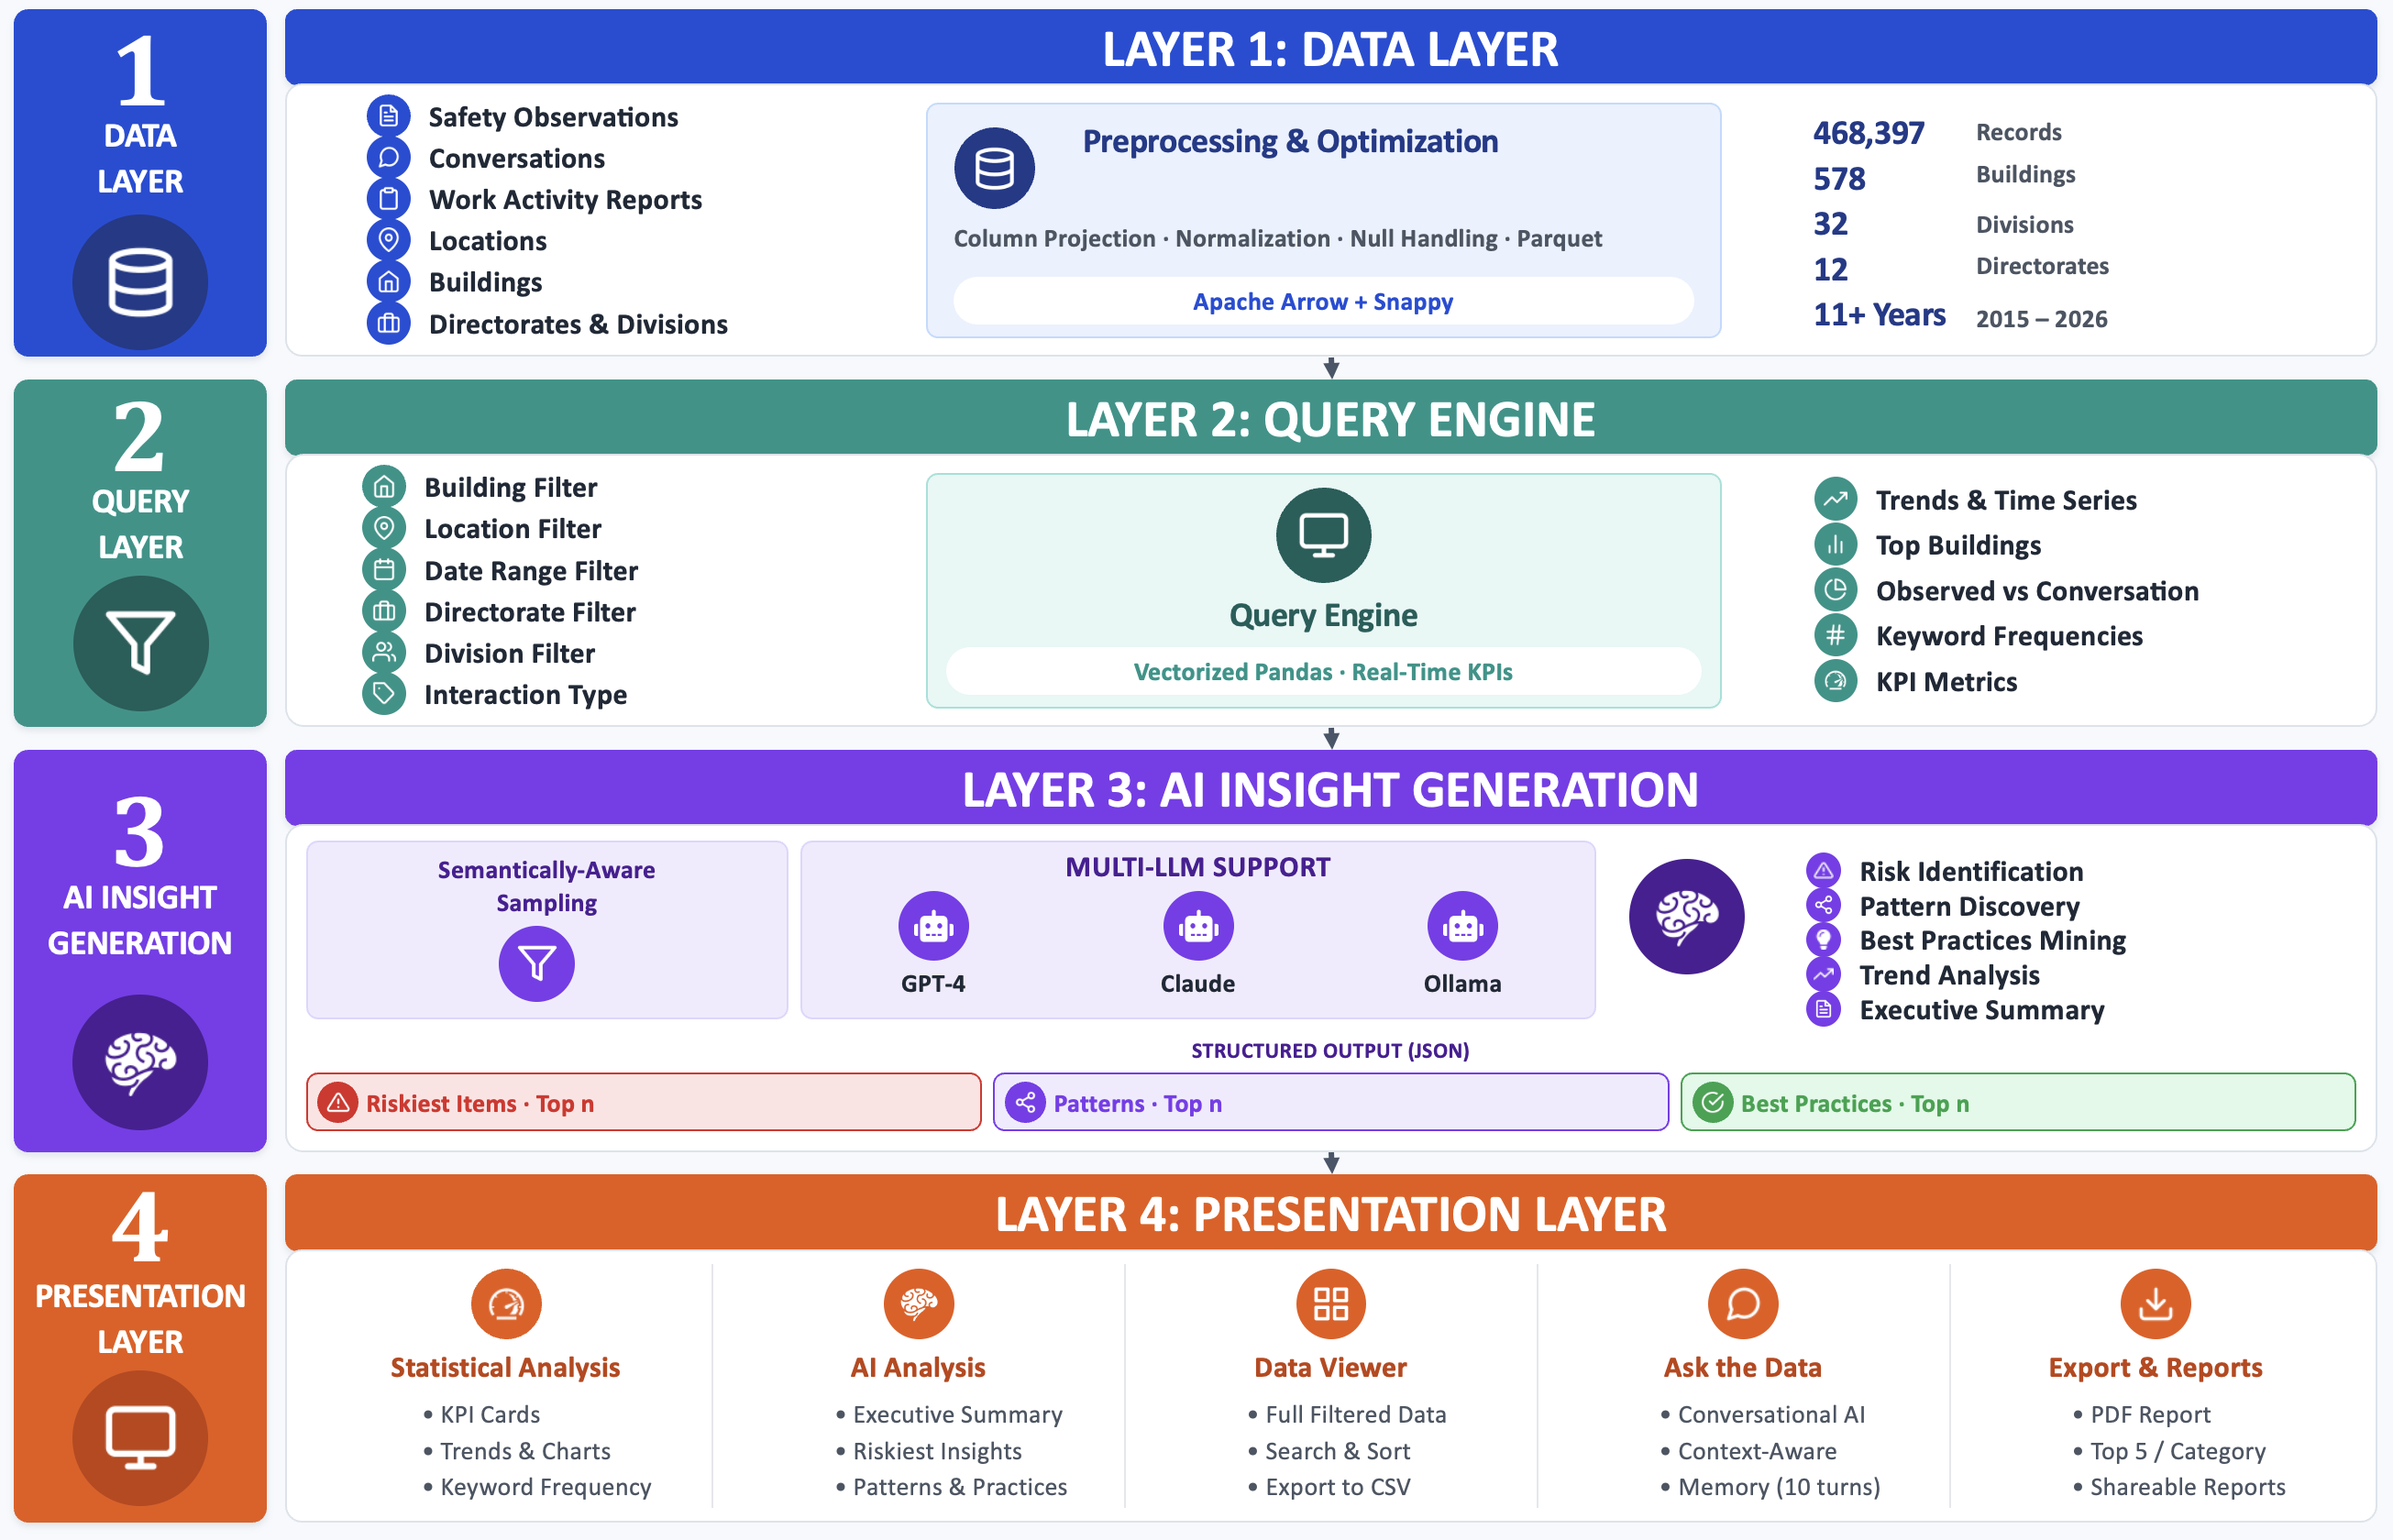
SafeLens analyzes a collection of 468,397 safety records spanning 11 years. A chart can show an increase in observations; the descriptions explain what people actually noticed. The system combines fast, deterministic statistics with AI analysis on demand, helping reviewers move from an organizational overview to a particular building, period, or interaction type. [1]
Four layers, one practical workflow
First, records are cleaned and stored in a compact Parquet file. Second, filters produce the relevant slice and its statistics. Third, a representative sample goes to a language model, which returns ranked risks, recurring patterns, and good practices. Finally, a dashboard lets users inspect insights, browse records, ask follow-up questions, and export a report. Think of it as a librarian who narrows the shelf before helping you read. [1]
Why sampling deserves a starring role
A model cannot reliably read the entire archive at once. But a random handful may miss uncommon record types. SafeLens uses Stratified Adaptive Query Sampling (SAQS): divide records by their existing interaction-type labels, allocate slots proportionally with a minimum floor, and sample within each group. The default budget is 300 records. This aims to preserve category diversity; it does not guarantee finding every rare hazard. Field observations and safety conversations also remain distinguishable, because they describe different kinds of evidence. [1]
An insight is an invitation to look closer
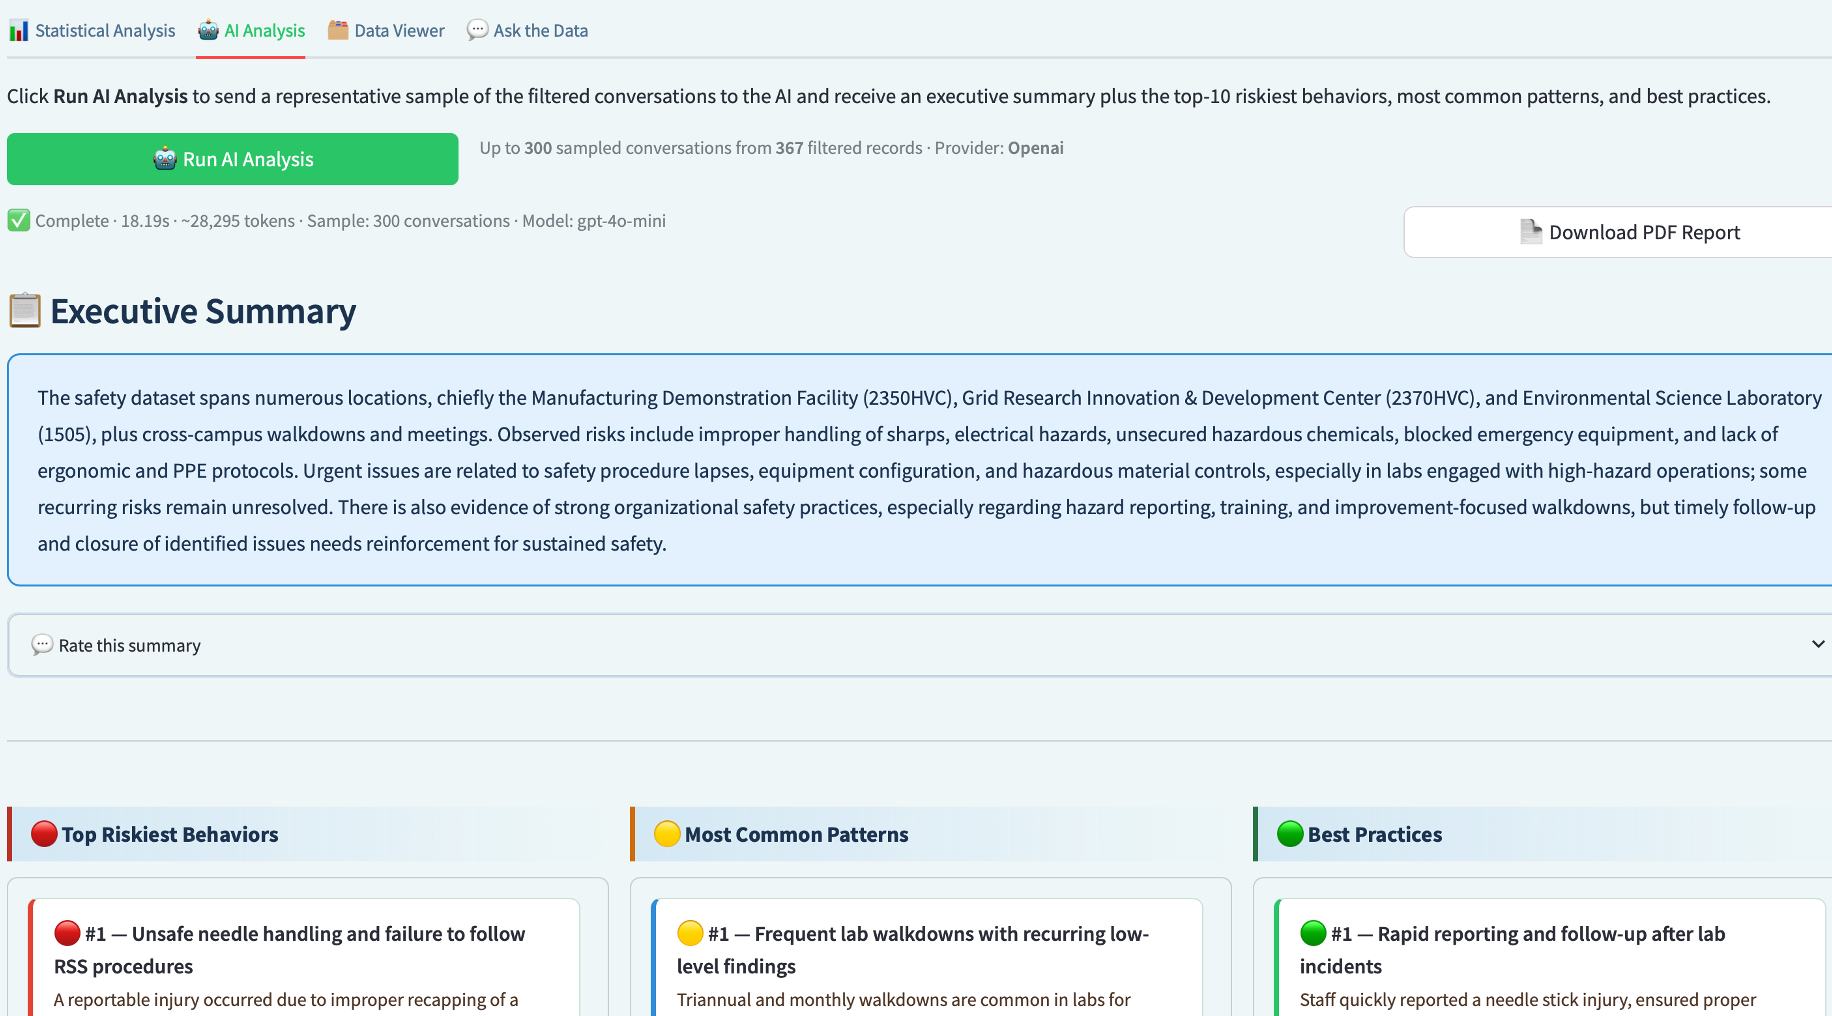
The interface presents risky behaviors, common patterns, and best practices side by side. Each insight includes context and a supporting excerpt. Reviewers can return to individual records or ask a follow-up question. In the paper’s usage discussion, managers treat the ranked list as an agenda for investigation, sometimes promoting an item that their domain knowledge makes important. The useful outcome is a better-informed review, with the human still deciding what warrants action. [1]
What the deployment reports
Across 136 evaluation runs, the paper reports an average response time of 19.49 seconds and a 6.6% system error rate. All 20 explicit feedback submissions were positive. Its definition of an error includes blank outputs, disrupted workflows, and freezes; it is not a measure of factual error in generated insights. [1]
| Reported measure | Value |
|---|---|
| Evaluation runs | 136 |
| Average response time | 19.49 seconds |
| System error rate | 6.6% |
| Explicit feedback submissions | 20 |
| Positive feedback | 20 of 20 |
Encouraging evidence, with clear boundaries
Twenty positive ratings are useful early feedback, not proof of universal satisfaction or factual accuracy. The study reports a deployed demonstration rather than a controlled test of accident reduction. Its strongest practical lesson is that filtering, sampling, traceable excerpts, and expert review matter alongside the language model. Future work includes token-aware sampling and stronger handling of institution-specific terminology. [1]